How to analyze bicycle infrastructure
We recommend using the open source GIS tool QGIS to visualize and perform more in-depth analysis of the data generated by the brokenspoke-analyzer.
Background
Typically, city boundaries will be in a local coordinate reference system (CRS). For example, cities in the US with boundaries defined by US Census shapefiles, typically use the EPSG:4269 (NAD83) CRS. The OpenStreetMap (OSM) basemap tile layer provided by QGIS’ QuickMapServices uses EPSG:3857 (Web Mercator). By default, a new QGIS session starts with an EPSG:4326 (WGS 84) CRS active.
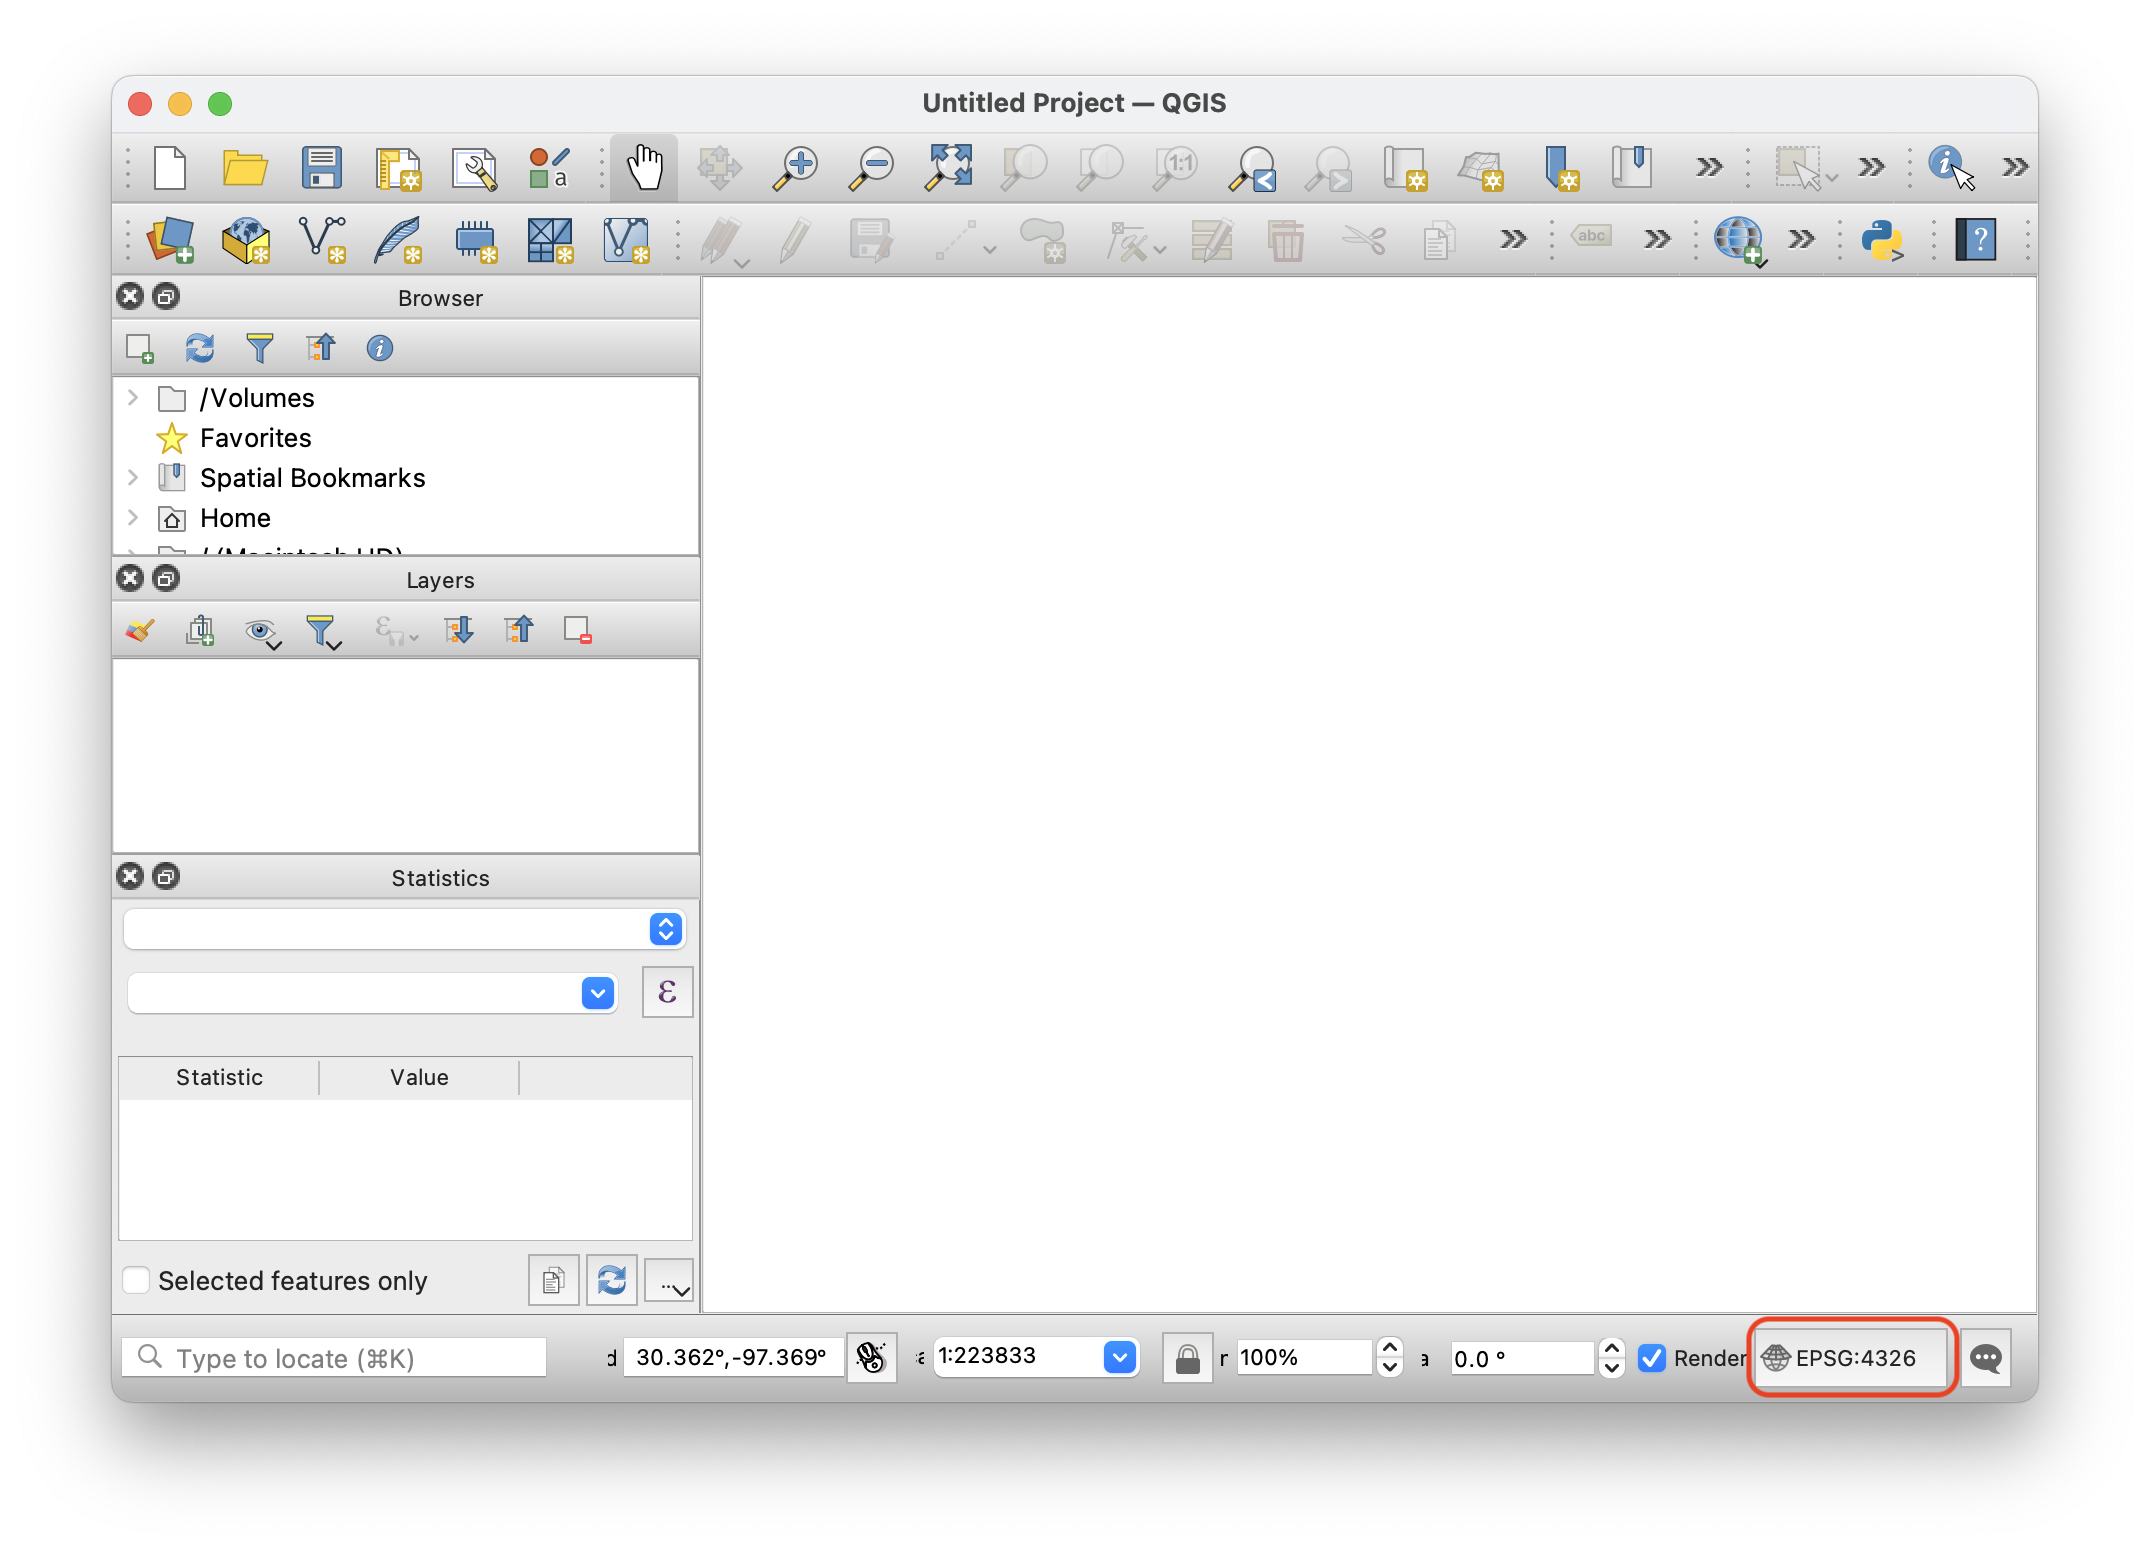
A new QGIS project
Depending on the order in which the layers are loaded, QGIS may ask you to confirm any map projections. Because of this, we suggest first opening any data files, such as a city boundary or a neighborhood_ways file, so that QGIS switches to the data file’s CRS. After that you can add a basemap and the basemap will be projected to the data file’s CRS.
Analysis
There are two main sources of data tha can be used for analysis: files that the brokenspoke-analyzer automatically exports and intermediate database tables that are not exported by the analyzer but that are accessible in the running PostGIS container.
brokenspoke-analyzer exports
To load exports from the analyzer you can use
Layer > Add Layer > Add Vector Layer... from QGIS’ menu. Then, in the Source
section you can select the shapefile or geojson file that you’d like to load.
Intermediate database tables
To load intermediate database tables, you need to connect to the PostGIS
container and load the tables directly. Ensure that the PostGIS container with
the results you want to load is running and then use
Layer > Add Layer > Add PostGIS Layers... from QGIS’ menu. You will need to
create a new connection, so in the Connections section click on New. Give
your connection a name, such as brokenspoke-analyzer, use localhost for your
Host, 5432 for the Port, postgres for the database. Then, when prompted for
your credentials, use postgres for the Username and postgres for the
Password (these correspond to the postgres container’s environment variables
POSTGRES_USER and POSTGRES_PASSWORD). Once you are connected to the database
you will see the available tables
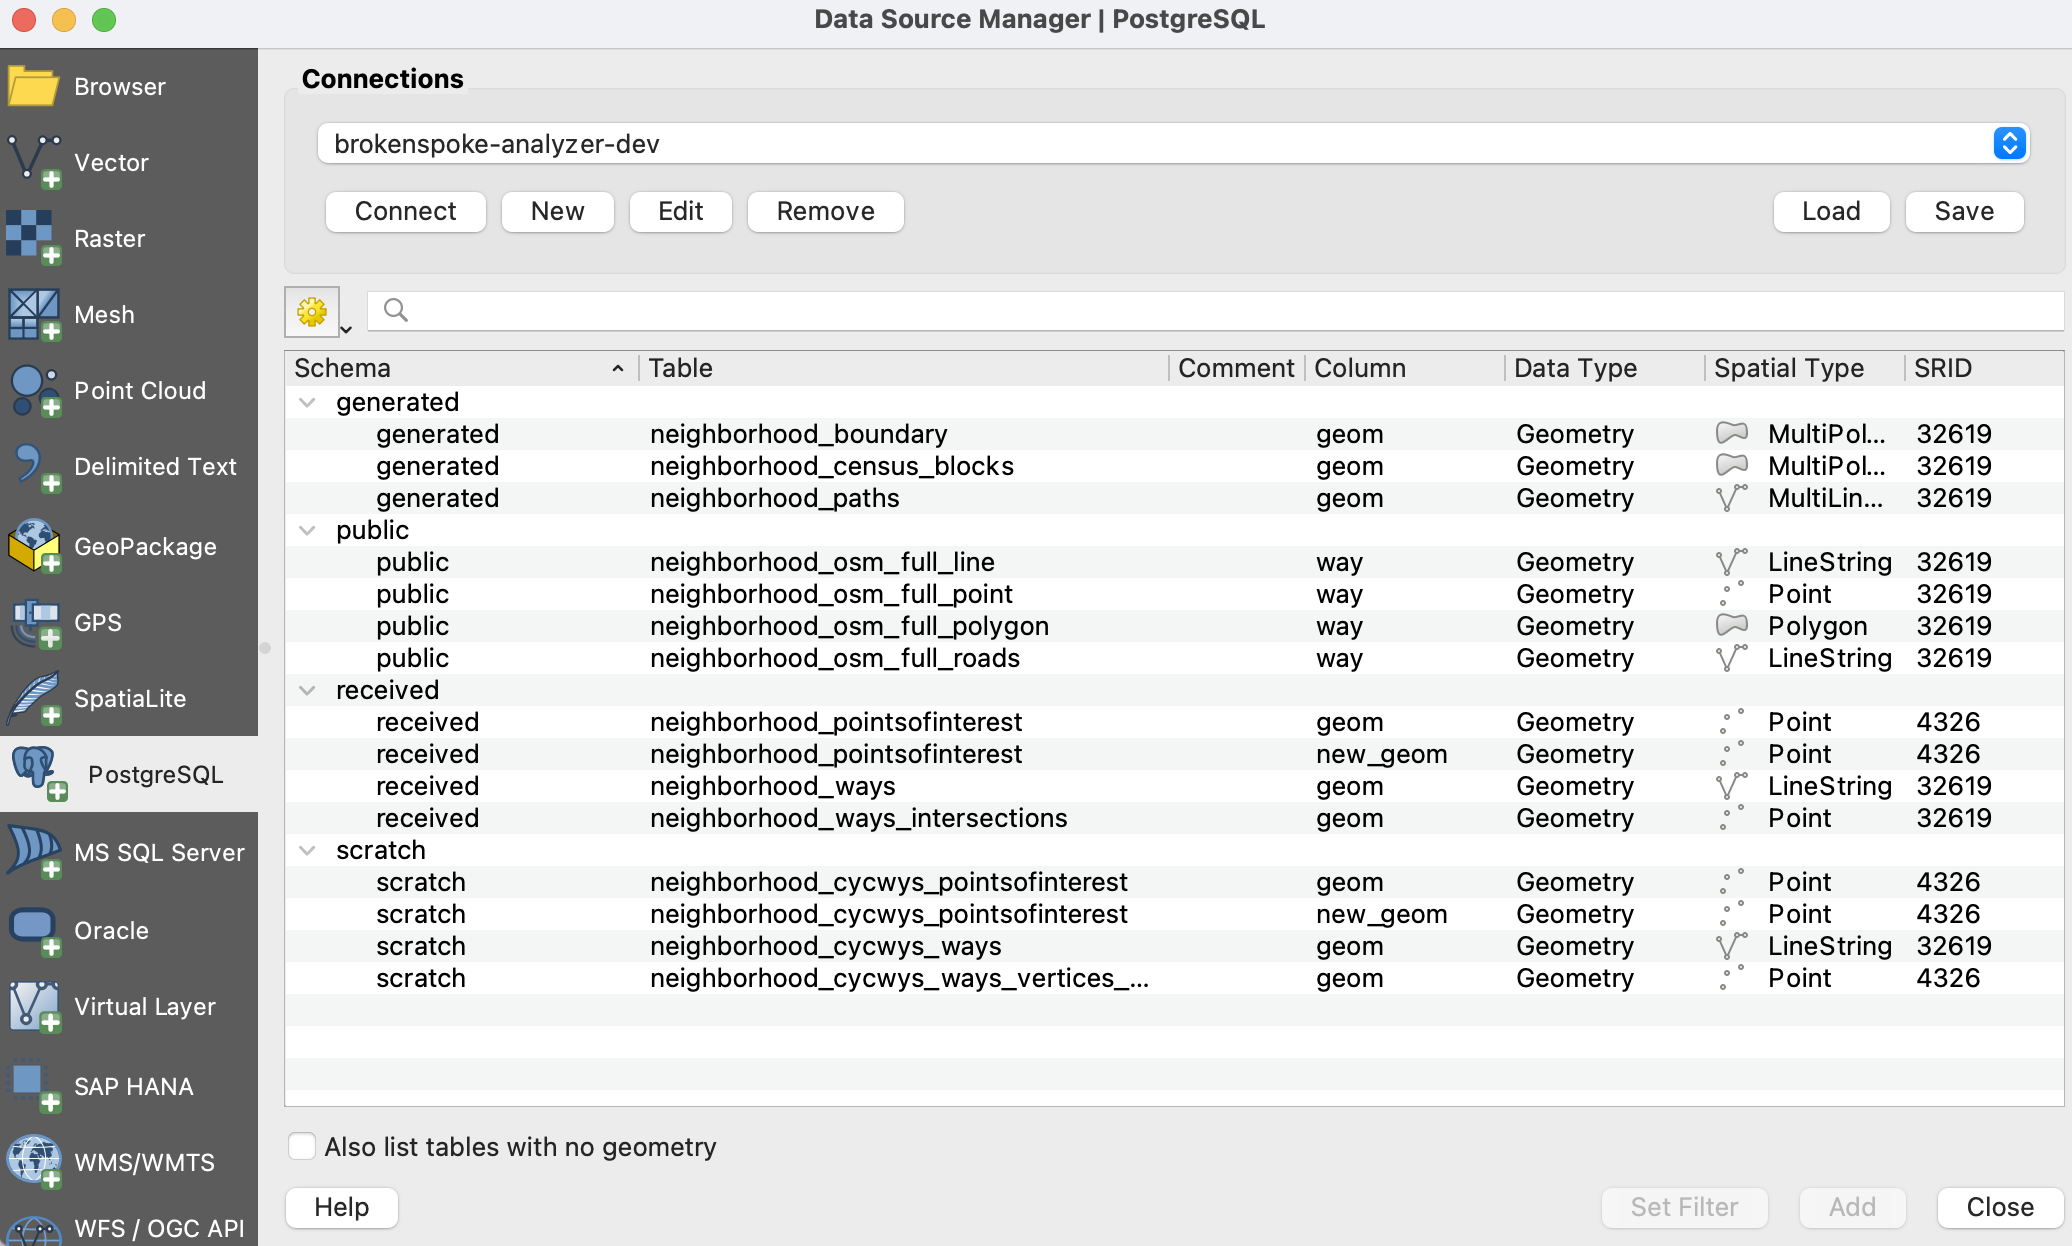
Loading PostGIS layers into QGIS
Select a table, click Add and the table will load as a regular layer in QGIS.
Note
To create the neighborhood_boundary and neighborhood_census_blocks, tables, first the best (planar) projected CRS is determined during the ingestion phase using GeoPandas, then the data is imported into PostGIS, and finally the data is projected to the best (planar) projected CRS.
Note that the CRS for boundary and census blocks shapefiles is North American Datum of 1983 (GCS NAD83 or equivalently EPSG:4269) but the SRID used by the shp2pgsql command is by default EPSG:4326. Since EPSG:4269 and EPSG:4326 are almost identical, the difference between calculated distances for roads/paths is negligible. Setting the default to EPSG:4326 is appropriate since the brokenspoke-analyzer is also used for shapefiles obtained from other sources besides the US census, such as for international cities.
Rendering
To render the generated bicycle infrastructure layer, neighborhood_ways, you
can modifiy the symbology to clearly show the different types of infrastructure.
In QGIS, right-click on the layer, go to Properties > Symbology, select
Categorized in the top drop-down, click on the ℰ (expression) symbol in
Value and enter the code shown below in the expression editor:
CASE
  WHEN "FT_BIKE_IN" = 'buffered_lane' THEN 'Buffered Lane'
  WHEN "FT_BIKE_IN" = 'lane' THEN 'Conventional Lane'
  WHEN "FT_BIKE_IN" = 'track' THEN 'Protected Lane'
  WHEN "XWALK" IS NULL AND "FUNCTIONAL" = 'path' AND "FT_BIKE_IN" IS NULL THEN 'Off-Street Path'
  WHEN "TF_BIKE_IN" = 'buffered_lane' THEN 'Buffered Lane'
  WHEN "TF_BIKE_IN" = 'lane' THEN 'Conventional Lane'
  WHEN "TF_BIKE_IN" = 'track' THEN 'Protected Lane'
  WHEN "XWALK" IS NULL AND "FUNCTIONAL" = 'path' AND "TF_BIKE_IN" IS NULL THEN 'Off-Street Path'
END
Then click on Classify to see the different infrastructure types.
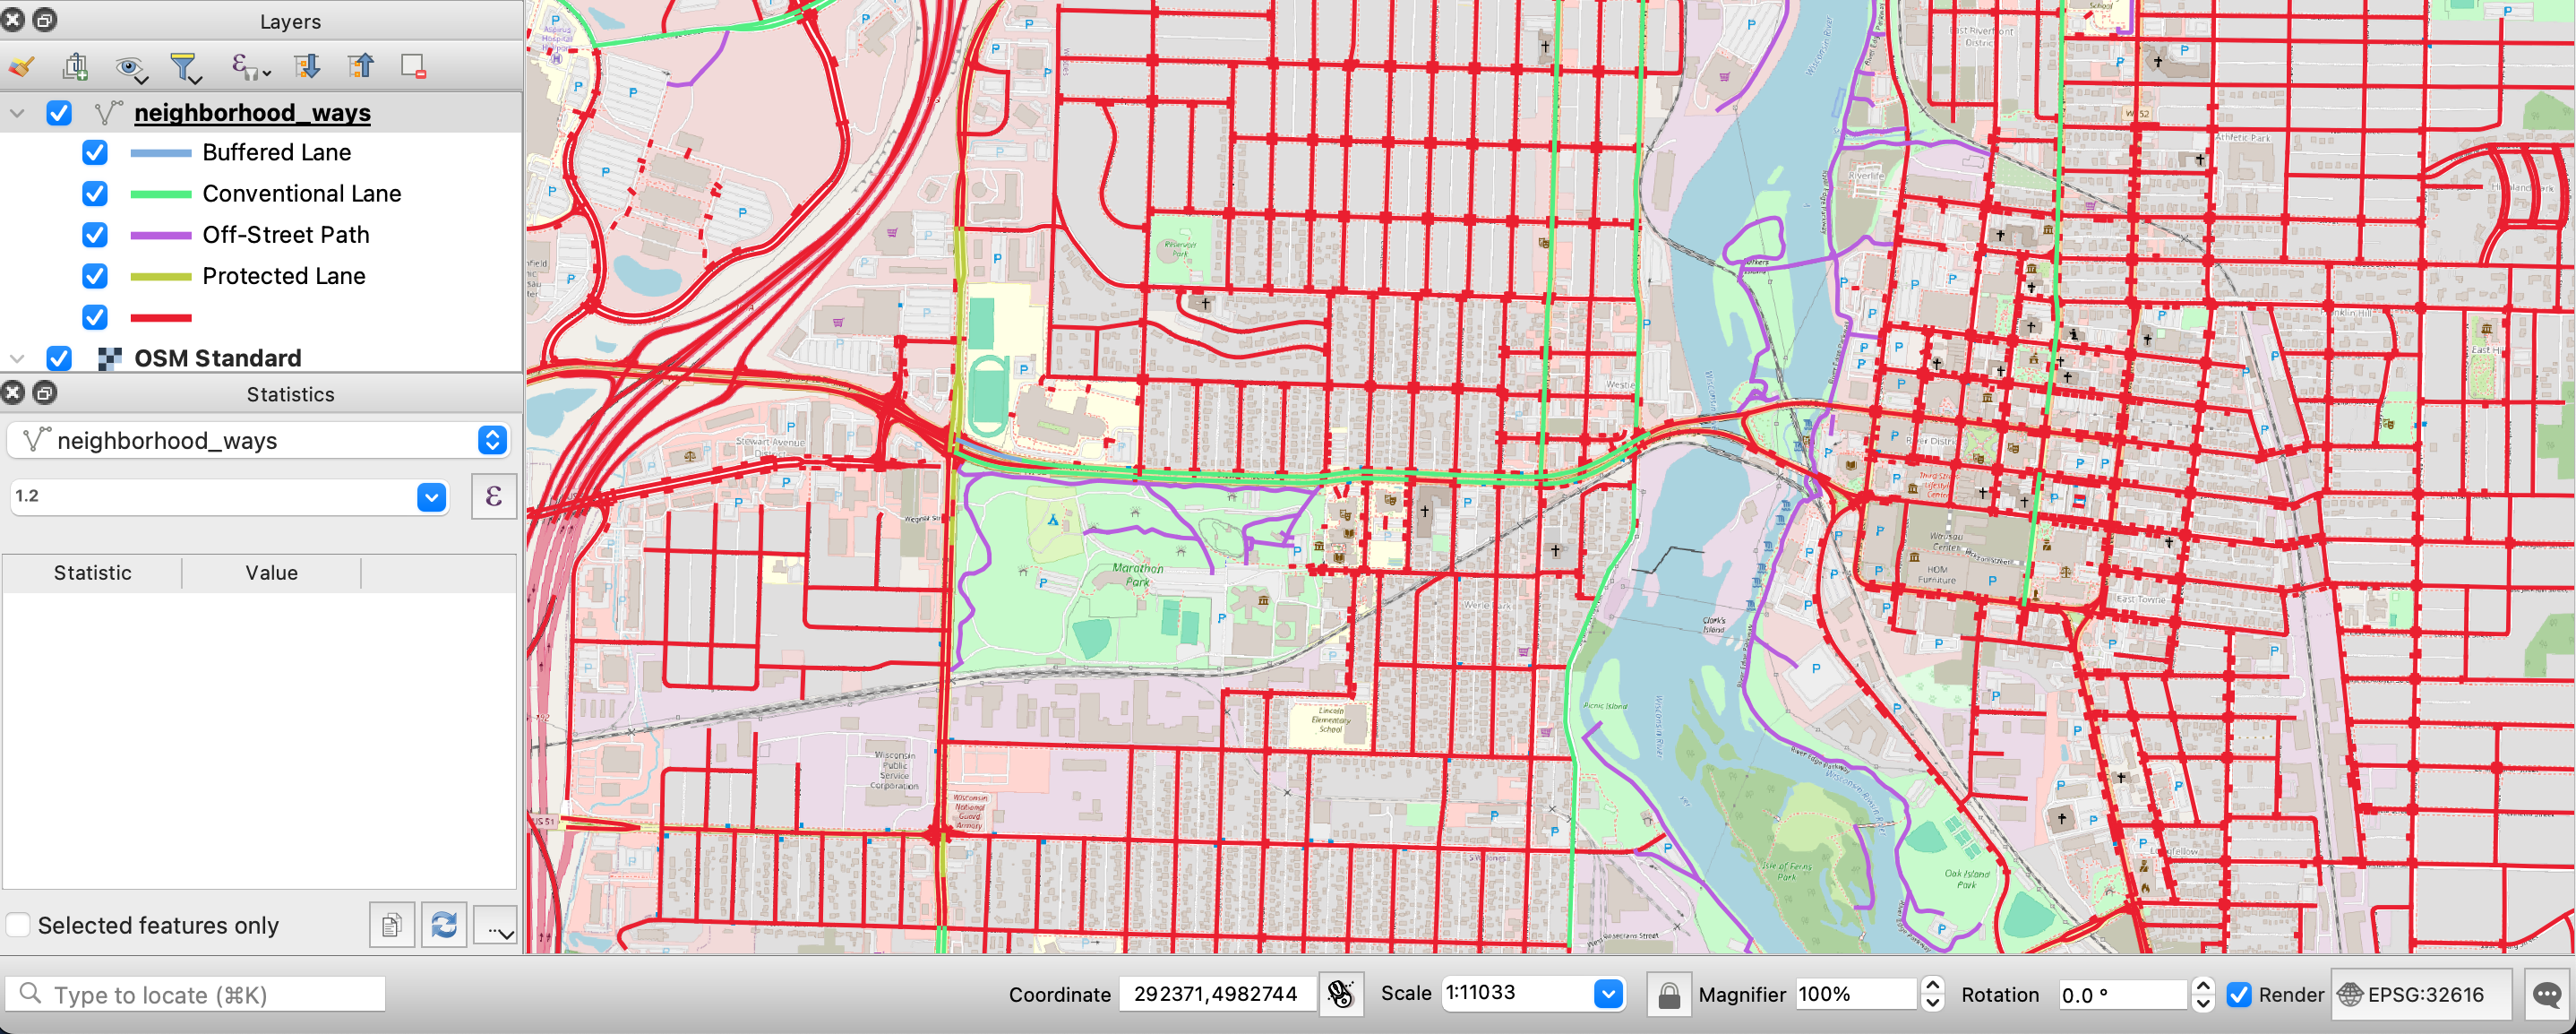
Rendering generated bicycle infrastructure
Making changes to the bicycle infrastructure
If after doing an analysis it is determined that the infrastructure type is wrong, there are two approaches to making changes: updating the SQL scripts of the analyzer or directly changing exisitng tags associated with elements in OSM.
Update the SQL scripts of the analyzer
The
scripts folder
of the analyzer holds code related to importing OSM elements into PostGIS. The
.style file
defines which OSM tags and elements are imported into PostGIS via osm2pgsql
while the
sql folder
contains the SQL scripts that set up the features and calculate connectivity and
stress.